Results Tab
From PatioWiki
| Line 238: | Line 238: | ||
More info about ''mouseLog'' events is available in the [[Log]] topic. | More info about ''mouseLog'' events is available in the [[Log]] topic. | ||
| - | == | + | == Extra Tab == |
[[File:Log_extra_analysis_en.png|right|thumb|200px|Extra tab]] | [[File:Log_extra_analysis_en.png|right|thumb|200px|Extra tab]] | ||
| - | + | This tab is only visible in analysis of exercises of [[Diferencias Exercise|Diferencias]] and [[Objetos Escena Exercise|Objetos Escena]] types from the [[Aprendo]] module and for exercises of [[Escribir Exercise|Escribir]] type from the [[Leo]] module. It contains a graph with the clicks made by the pupil, joined by arrows in order to show the sequence she has followed. | |
| - | + | Using a sliding control you can go forward or backward in time so the sequence do. There is other sliding control too in order to change the transparency of the background image of the exercise, so all points can be easily identified. | |
| - | + | There is other way for replay exercises like the pupil did it, using the [[Exercise Player]]. | |
| - | == | + | == Log File Tab == |
[[File:Log_log_file_en.png|right|thumb|200px|Log file]] | [[File:Log_log_file_en.png|right|thumb|200px|Log file]] | ||
| - | + | In this tab, the last one, you can see the [[Log]] file coded in ([http://es.wikipedia.org/wiki/XML XML]), just in case you want check it at very low level. | |
| - | = | + | = Graphs = |
Este análisis gráfico sólo se aplica a los ejercicios del tipo [[Ejercicio Diferencias|Diferencias]] y [[Ejercicio Objetos Escena|Objetos Escena]] ya que ambos consisten en buscar objetos en una imagen, favoreciendo así el análisis de los puntos de búsqueda. | Este análisis gráfico sólo se aplica a los ejercicios del tipo [[Ejercicio Diferencias|Diferencias]] y [[Ejercicio Objetos Escena|Objetos Escena]] ya que ambos consisten en buscar objetos en una imagen, favoreciendo así el análisis de los puntos de búsqueda. | ||
Revision as of 12:34, 17 October 2011
The Results Tab, part of the LogProcessor application, is a container of analysis windows, graphs and patterns. Each window can be individually minimized or closed, so that this tab behaves like a real workbench.
Analysis
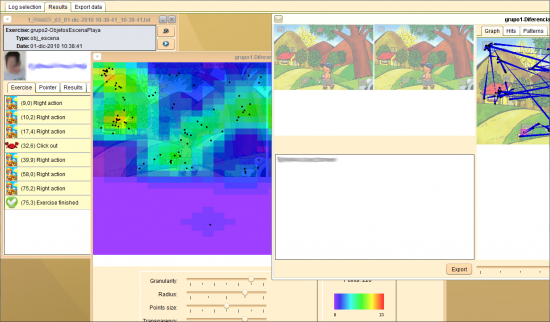
All analysis windows have a common header which contains the Exercise name, their type and the date when they were performed. Below the header, the name and the picture of the pupil are arranged in just one line in single exercises or in several ones in multi-user exercises.
Besides, there are two buttons in the top right corner. The first one is for watching the exercise resolution video, if it is available and the multimedia player has been configured in the Configuration Panel. The second button is used to replay the exercise with the Exercise Player.
Finally, there are a series of tabs that although they are commons to all analysis windows, the data showed in each of them are different depending on the Application and the Exercise type:
Exercise Tab
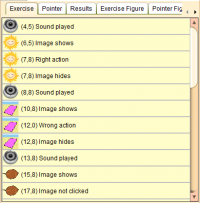
This tab shows a list with the data from the abstractLog section of a Log file.
The available info depends on the pupil's behaviour and the exercise type. Usually the abstractLog section contains data about high-level events happened during the exercise perform.
Notice that each line of the list has an event icon followed by the event time mark in seconds and a description of it. Double-clicking on a line, you can visualize the image in image events while in sound events you can hear the proper sound.
More info about abstractLog events is available in the XSD Files topic.
Pointer Tab
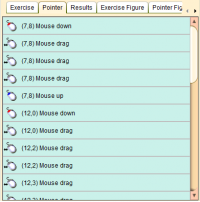
This tab shows a list with the data from the mouseLog section of a Log file.
The available info depends on the pupil's behaviour because in the mouseLog section all low level events are recorded during the exercise perform.
Note that each line of the list has an event icon followed by the event time mark in seconds and the description of it.
More info about mouseLog events is available in the Log topic.
Results Tab
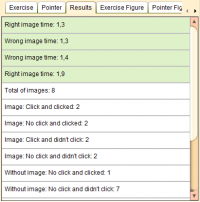
In this tab an specific analysis of the exercise is made. As a result, data shown differs according to the type of exercise:
Results for Emparejar Sonido-Imagen exercises
For Emparejar Sonido-Imagen exercises the following data is obtained:
- Specific Indicators
- IE-1.1: Image: Click and clicked
- IE-1.2: Image: Don't click and clicked
- IE-1.3: Image: Click and not clicked
- IE-1.4: Image: Don't click and not clicked
- IE-1.5: Without image: Don't click and clicked
- IE-1.6: Without image: Don't click and not clicked
- Common Indicators
- IC-1.1: Total of images
- IC-1.2: Average time of right image
- IC-1.3: Deviation time of right image
- IC-1.4: Average time of wrong image
- IC-1.5: Deviation time of wrong image
- IC-1.6: Exercise length
Results for Diferencias exercises
For Diferencias exercises the following data is obtained:
- Specific Indicators
- IE-2.1: Hits on differences
- IE-2.2: Clicks out of image
- IE-2.3: Clicks on the left image
- IE-2.4: Clicks on the right image
- Common Indicators
- IC-2.1: Game ended
- IC-2.2: Time of first right image
- IC-2.3: Average time of right image
- IC-2.4: Deviation time of right image
- IC-2.5: Exercise length
Results for Memoria exercises
For Memoria exercises the following data is obtained:
- Specific Indicators
- IE-3.1: Wrong clicks
- IE-3.2: Previous outside clicks
- IE-3.3: Later outside clicks
- IE-3.4: Repeated wrong clicks
- Common Indicators
- IC-3.1: Right clicks
- IC-3.2: Game ended
- IC-3.3: Time of first right image
- IC-3.4: Average time between right images
- IC-3.5: Deviation time between right images
- IC-3.6: Time of first right image
- IC-3.7: Average time between wrong images
- IC-3.8: Deviation time between wrong images
- IC-3.9: Exercise length
Results for Objetos Escena exercises
For Objetos Escena exercises the following data is obtained:
- Specific Indicators
- IE-4.1: Instructions clicks
- IE-4.2: Wrong clicks
- Common Indicators
- IC-4.1: Right clicks
- IC-4.2: First right click time
- IC-4.3: Time between right clicks
- IC-4.4: Average time between right clicks
- IC-4.5: Deviation time between right clicks
- IC-4.6: First instruction click time
- IC-4.7: Average time between clicks over instructions
- IC-4.8: Deviation time between clicks over instructions
- IC-4.9: First wrong click time
- IC-4.10: Average time between wrong clicks
- IC-4.11: Deviation time between wrong clicks * Common Indicators
Results for Reflejos exercises
For Reflejos exercises the following data is obtained:
- Specific Indicators
- IE-5.1: Total of images
- Common Indicators
- IC-5.1: Right clicks
- IC-5.2: Outside clicks
- IC-5.3: No image clicks
- IC-5.4: Average time of right clicks
- IC-5.5: Deviation time of right clicks
- IC-5.6: Average time of outside clicks
- IC-5.7: Deviation time of outside clicks
- IC-5.8: Average time of no image clicks
- IC-5.9: Deviation time of no image clicks
- IC-5.10: Average distance of outside clicks
- IC-5.11: Deviation distance of outside clicks
- IC-5.12: Exercise length
Results for Selecciona Distinta
For Selecciona Distinta exercises the following data is obtained:
- Specific Indicators
- IE-6.1: Consecutive right clicks
- IE-6.2: Repeated right clicks
- Common Indicators
- IC-6.1: Right clicks
- IC-6.2: Outside clicks
- IC-6.3: Wrong clicks
- IC-6.4: First click time
- IC-6.5: First right click time
- IC-6.6: Average time between right clicks
- IC-6.7: Deviation time between right clicks
- IC-6.8: First wrong click time
- IC-6.9: Average time between wrong clicks
- IC-6.10: Deviation time between wrong clicks
- IC-6.11: First outside click time
- IC-6.12: Average time between outside clicks
- IC-6.13: Deviation time between outside clicks
- IC-6.14: Average time between right repeated clicks
- IC-6.15: Deviation time between right repeated clicks
- IC-6.16: Exercise length
Results for Serie
For Serie exercises the following data is obtained:
- IC: Total right images
- IE: Total wrong images
- MI: Total moved images
- MTIC: Average time of right image
- DTIC: Deviation time of right image
- MTIE: Average time of wrong image
- DTIE: Deviation time of wrong image
- MTIFC: Average time outside image
- DTIFC: Deviation time of outside image
- DE: Exercise length
Results for Serie Multiusuario
For Serie Multiusuario exercises the following data is obtained:
- Single Indicators
- I.1: Total right images
- I.2: Total wrong images
- I.3: Total moved images
- I.4: Picked turns
- I.5: Given turns
- I.6: No waited turns
- I.7: Score
- Group Indicators
- G.1: Exceeded turns
- G.2: Number of players
- G.3: Placed pieces
- G.4: Group score
- G.5: Exercise length
Results for Escribir
For Escribir exercises the following data is obtained:
- Ex1: Total repeated videos
- Ex2: Exercise length
Results for Nube de Letras
For Nube de Letras exercises the following data is obtained:
- Ex1: Total token hits
- Ex2: Total token misses
- Ex3: Total identification hits
- Ex4: Total identification misses
- Ex5: Exercise length
Exercise Figure Tab
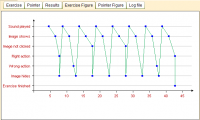
This tab contains a graph made with the data from the abstractLog section of a Log file. The Y axis represents the exercise events, and the X axis is used for the exercise time, so it will be as long as the time pupil spent in finish the exercise.
In the same way as in the Exercise Tab the data available will change depending on the pupil behaviour and the type of exercise.
Note that the goal of this analysis is build a temporal diagram showing the pupil's actions in order to drawn an visual inference from her behaviour and order taken to finish the exercise.
More info about abstractLog events is available in the XSD Files topic.
Pointer Figure Tab
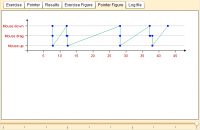
This tab contains a graph made with the data from the mouseLog section of a Log file. The Y axis represents the pointer events, and the X axis is used for the exercise time. Like the previous tab, the length of the time axis depends on the time pupil spent in finish the exercise.
Note that this figure could be hard to read when the pupil behaves erratically going out of the goal of the exercise.
More info about mouseLog events is available in the Log topic.
Extra Tab
This tab is only visible in analysis of exercises of Diferencias and Objetos Escena types from the Aprendo module and for exercises of Escribir type from the Leo module. It contains a graph with the clicks made by the pupil, joined by arrows in order to show the sequence she has followed.
Using a sliding control you can go forward or backward in time so the sequence do. There is other sliding control too in order to change the transparency of the background image of the exercise, so all points can be easily identified.
There is other way for replay exercises like the pupil did it, using the Exercise Player.
Log File Tab
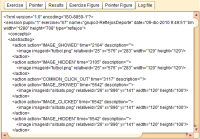
In this tab, the last one, you can see the Log file coded in (XML), just in case you want check it at very low level.
Graphs
Este análisis gráfico sólo se aplica a los ejercicios del tipo Diferencias y Objetos Escena ya que ambos consisten en buscar objetos en una imagen, favoreciendo así el análisis de los puntos de búsqueda.
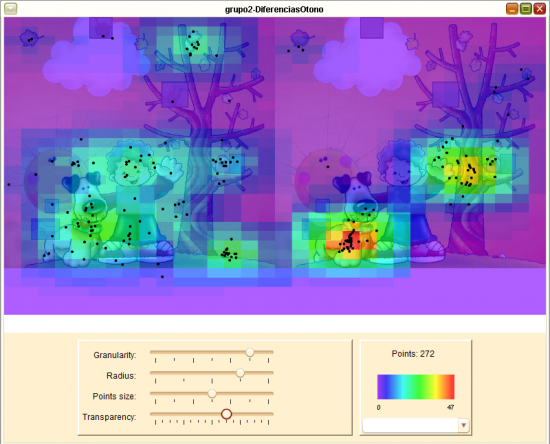
En la gráfica se representan las pulsaciones realizadas en el ejercicio pudiéndose combinar más de uno siempre y cuando se trate de ejercicios del mismo tipo y que hayan sido realizados en el mismo tamaño de ventana. Luego el análisis superpone una capa en la que se representa por medio de colores la densidad de puntos correspondiente a cada zona. Esta representación puede ser modificada variando los ajustes por medio de los controles deslizables del panel inferior de la ventana:
- Granularidad
- Modifica las dimensiones de la cuadrícula de celdas.
- Radio
- Controla la influencia de las celdas vecinas en el valor de cada celda individual.
- Tamaño de los puntos
- Modifica el tamaño en que se representan los puntos.
- Transparencia
- Controla el nivel de transparencia de la capa de densidades permitiendo visualizar en menor o mayor medida la imagen de fondo.
Además se provee una escala en la que se representa la equivalencia entre cada color de la gráfica y la cantidad de puntos que representa. Por encima de la escala se informa del número total de puntos en la gráfica y por debajo se encuentra un selector, inicialmente vacío, que permite resaltar los puntos de un alumno en particular, lo que tendrá sentido sólo en las gráficas en las que se representan puntos de varios alumnos.
Patrones
Como los ejercicios del tipo Diferencias y Objetos Escena contienen puntos de búsqueda, éstos pueden ser interpretados desde el punto de vista de patrones. Este análisis además de calcular los patrones de Búsqueda y de Aciertos, permite visualizar la gráfica direccional de búsqueda combinada para varios alumnos.
La ventana consta de tres divisiones, una gráfica en la división superior izquierda en donde se se visualiza la traza direccional de los puntos para el alumno seleccionado, una lista en la división inferior izquierda en donde se selecciona el alumno a resaltar y una panel a la derecha que contiene, a su vez, tres pestañas:
- Gráfica
- Contiene todas las gráficas direccionales correspondientes a los logs analizados, resaltando los correspondientes al alumno seleccionado en la lista.
- Aciertos
- Contiene todos los patrones de aciertos extraídos de los logs analizados.
- Patrones
- Contiene los patrones de pulsaciones de los logs analizados.
Por último existe la posibilidad de exportar en formato CSV la información referente a los patrones obtenidos del análisis mediante la el botón Exportar.
